Data can be local

Most of the chart libraries expect the coder to declare the data for the entire chart. The paper A layered grammar of graphics states:
When creating a plot we start with data.
At the same time, it defines layers as:
each layer having one geometric object, one statistical transformation, one position adjustment, and optionally, one dataset and set of aesthetic mappings
And this is where we like ❤️🔥 the layered grammar.
At the logic level, data can be local to the visual item that shows it.
With chrt we followed the principle that together with the more traditional approach of declaring the data at a chart level:
Chrt().data([...])
We can also skip completely the data first and declare it directly with the component that uses it and let chrt manage the data internally 🪄:
Chrt()
    .add(chrtColumns().data([...])
    .add(chrtLine().data[...])
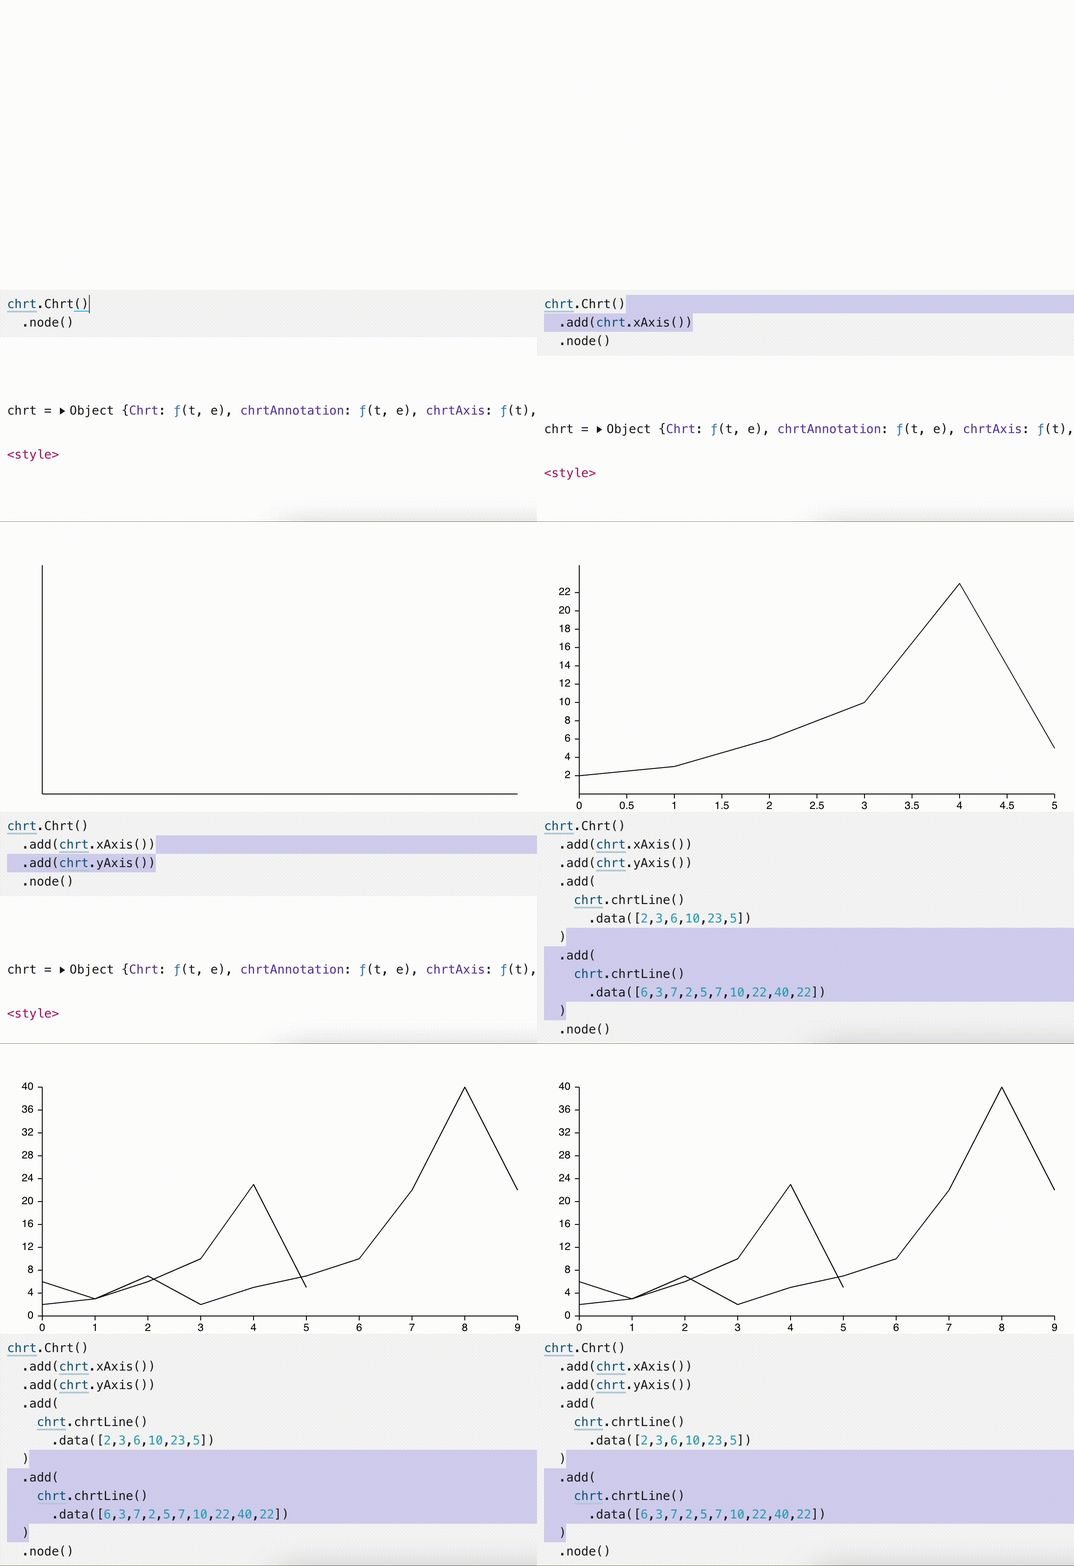
With this approach we can dynamically add components to the chart with their own data:
Chrt()
  .add(xAxis())
  .add(yAxis())
  .add(
    chrtLine()
      .data([2,3,6,10,23,5])
  )
  .add(
    chrtLine()
      .data([6,3,7,2,5,7,10,22,40,22])
  )
In the above ☝️ code snippet, we are adding two lines 📈 in the chart with their own set of data 📦, chrt will take care of updating scales and axes based on the combination of the two datasets as shown below (and yes! chrt works in Observable 🎊):
