How should the code look like?
The first chart library I used (almost 15 years ago) was jpgraph for PHP, then after too much customization of its code, I decided it was time to create my library. I did it with ActionScript and Flash, it was called Atomicharts, it was doing few things: line charts, area charts, and bar charts. I truly enjoyed the experience of putting together the library.
Then Javascript became the standard for everything web, and I spent a summer working with Highcharts. At that time Highcharts was canvas-based, and we had to squeeze in a lot of time into the optimization of its code for IE9 🥶.
Then I discovered prototype.js and eventually D3. D3 opened up a new universe of possibilities and fun. The feeling of freedom you get with D3 was unique: I could finally build whatever my imagination was suggesting.
Most of the chart libraries start from a JSON-like config file, however, I don’t think as humans we think in config-files 😛. I never enjoyed these libraries, and that is the reason why I found myself starting from scratch with D3 every single time I wanted to build 🏗️ a chart.
I played with R and ggplot2, I loved its way to declaratively creating graphics, based on The Grammar of Graphics, with the concept of components of the layered grammar (A layered grammar of graphics).
And here came chrt!
Inspired by ggplot2, d3, and Scratch, we started thinking about a way of coding charts more casually without compromising on the level of details that could be customized.
How would I like to build a chart?
After some tinkering around I scribbled ✍️ down the following:
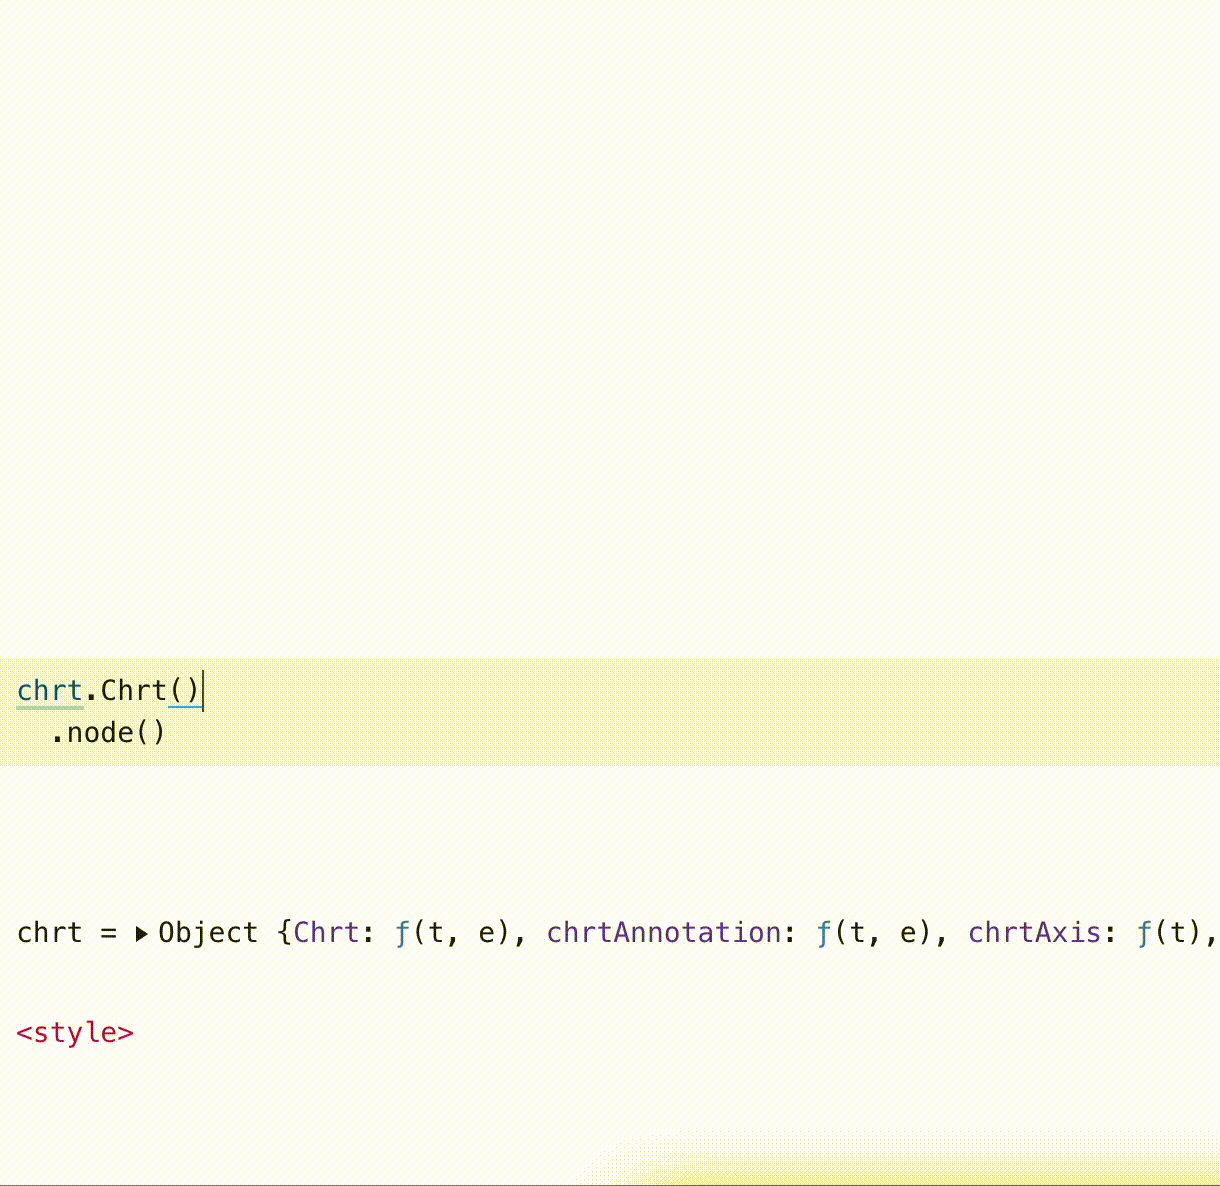
Chrt()
    .data([...])
    .add(xAxis())
    .add(yAxis())
    .add(lineChart())
This ☝️ was the first draft, and it was actually exciting!
Then I thought every building block should have a way to add other blocks:
Chrt()
    .data([...])
    .add(
        xAxis().add(xAxisRange()
    )
    .add(
        yAxis().add(axisTitle())
    )
    .add(lineChart().add(Markers).add(Labels))
And what about customizing a single block? No JSON config files 🙅♀️, but simple chained methods to be called directly:
lineChart()
    .color('#333')
    .opacity(0.4)
    .dashed()
This was an important milestone for chrt, figuring out how the code should look like gave us a direction to follow.